Notes about DMV’s in General
DMV data is discarded when the SQL Server service is restarted as it is stored in memory and has virtually no impact on the server when querying it because it has been collected already. SQL Server Deep Dives Vol 1, pg 383
SQL Server DMV/DMFs that every DBA should know
SQL Server 2012 Dynamic Management Views and Functions
Execution Related
sys.dm_exec_connections
sys.dm_exec_sessions
sys.dm_exec_requests
sys.dm_exec_cached_plans
sys.dm_exec_query_plans
sys.dm_exec_sql_text
sys.dm_exec_query_stats
Index Related
sys.dm_db_index_physical_stats
sys.dm_db_index_usage_stats
SQL Server Operating System
sys.dm_os_performance_counters
sys.dm_os_schedulers
sys.dm_os_nodes
sys.dm_os_waiting_tasks
sys.dm_os_wait_stats<
Here is the list of 201 different wait states for this DMV: sys.dm_os_wait_stats
I/O Related
sys.dm_io_virtual_file_stats
DMV’s to Assist in Analyzing Blocking
|
1 2 3 |
SELECT * FROM sys.dm_os_wait_stats ORDER BY waiting_tasks_count DESC |
and
|
1 2 |
SELECT * FROM sys.dm_os_waiting_tasks |
Query utilizing DMVs and CROSS APPLY statements identifying the slowest queries
|
1 2 3 4 5 6 7 8 9 10 11 12 13 14 15 16 17 |
SET TRANSACTION ISOLATION LEVEL READ UNCOMMITTED SELECT TOP 20 cast(qs.total_elapsed_time / 1000000.0 AS DECIMAL(28, 2)) AS [Total Elapsed Duration (s)] , qs.execution_count , substring(qt.text, (qs.statement_start_offset / 2) + 1, ((CASE WHEN qs.statement_end_offset = -1 THEN len(convert(NVARCHAR(MAX), qt.text)) * 2 ELSE qs.statement_end_offset END - qs.statement_start_offset) / 2) + 1) AS [Individual Query] , qt.text AS [Parent Query] , db_name(qt.dbid) AS DatabaseName , qp.query_plan FROM sys.dm_exec_query_stats qs CROSS APPLY sys.dm_exec_sql_text(qs.sql_handle) qt CROSS APPLY sys.dm_exec_query_plan(qs.plan_handle) qp INNER JOIN sys.dm_exec_cached_plans cp ON qs.plan_handle = cp.plan_handle ORDER BY total_elapsed_time DESC |
Finding missing Indexes on tables
|
1 2 3 4 5 6 7 8 9 10 11 12 13 |
SET TRANSACTION ISOLATION LEVEL READ UNCOMMITTED SELECT TOP 20 ROUND(s.avg_total_user_cost * s.avg_user_impact * (s.user_seeks + s.user_scans), 0) AS [Total Cost], s.avg_user_impact AS 'Avg User Impact', d.statement AS TableName, d.equality_columns AS 'Equality Usage', d.inequality_columns AS 'Inequality Usage', d.included_columns AS 'Include Columns' FROM sys.dm_db_missing_index_groups g INNER JOIN sys.dm_db_missing_index_group_stats s ON s.group_handle = g.index_group_handle INNER JOIN sys.dm_db_missing_index_details d ON d.index_handle = g.index_handle ORDER BY [Total Cost] DESC |
Displaying Index Fragmentation on a specific table
|
1 |
SELECT * FROM sys.dm_db_index_physical_stats (DB_ID(N'database'), OBJECT_ID(N'table'), NULL, NULL , 'DETAILED'); |
The Top 3 Plan Caches
* CACHESTORE_OBJCP — Compiled plans for objects such as stored procedures, functions, and triggers
* CACHESTORE_SQLCP — Cached plans for SQL statements or batches that aren’t in stored procedures. If your application doesn’t use stored procedures, then the plans are cached here. However, they are much less likely to be reused than stored procedure plans, which can lead to a bloated cache taking a lot of memory (see the “Optimize for Ad-Hoc Workloads” section later in the chapter).
* CACHESTORE_PHDR — Algebrizer trees for views, constraints, and defaults. An algebrizer tree is the parsed SQL text that resolves table and column names.
The SQL to view these caches is:
|
1 2 3 4 5 6 7 8 |
SELECT name ,type ,pages_kb ,entries_count FROM sys.dm_os_memory_cache_counters ORDER BY pages_kb DESC; |
Displaying Cached Execution Plans
|
1 2 3 4 5 6 |
SELECT TOP 30 * FROM sys.dm_exec_cached_plans cp CROSS APPLY sys.dm_exec_sql_text(cp.plan_handle) ORDER BY size_in_bytes DESC |
 |
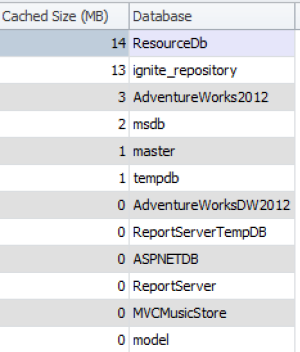
Display the size of a plan cache per database
|
1 2 3 4 5 6 7 8 9 10 11 12 13 |
SELECT count(*)*8/1024 AS 'Cached Size (MB)' ,CASE database_id WHEN 32767 THEN 'ResourceDb' ELSE db_name(database_id) END AS 'Database' FROM sys.dm_os_buffer_descriptors GROUP BY db_name(database_id), database_id ORDER BY 'Cached Size (MB)' DESC |
 |
Views – 3370