10987B – Performance Tuning and Optimizing SQL Databases
Trainer: Bill Chapman
Download Companion Content for Microsoft Official Courseware (MOC)
Online Syllabus for Course 10987B
Mon Dec 12 – Thur Dec 15
Monday
Session 1 – SQL Server Arch, Scheduling and Waits – Module 01
-Windows has a scheduler to manage scheduling starvation for other tasks needing a thread to the CPU.
-Premptive schedulnig is highest-priority task first, but lead to thread starvation.
-low-riority threads are “pre-empted” out of the process by higher-priority threads
-Windows uses preemptive
-SQL uses non-premptive scheduling, helps reduce dead-locking of lower priority tasks.
-SQLOS started in SQL 2005, UMS in 2000
– worker list
-runnable list-those tasks that can run now
-waiter list, those tasks waiting on other resources to become available so they can be placed and the runnable list
-runnable-> running -> completed, or moved to a waiter list
-quantum exhausted, go back to runnable, unless there is nothing else waiting.
!! @@SPID = your spid
– a large update can cause blocking
?? does rebuilding a large index on a large table possibly cause blocking while the reindexing happens?
Use this also with sp_who2 or sp_WhoIsActive to see what requests are being executed:
|
1 |
SELECT * from sys.dm_exec_requests WHERE session_id > 50 |
Do this to clear specific DMV data:
|
1 |
DBCC SQLPERF('sys.dm_os_wait_stats', CLEAR); |
Session 2 – SQL Server I/O
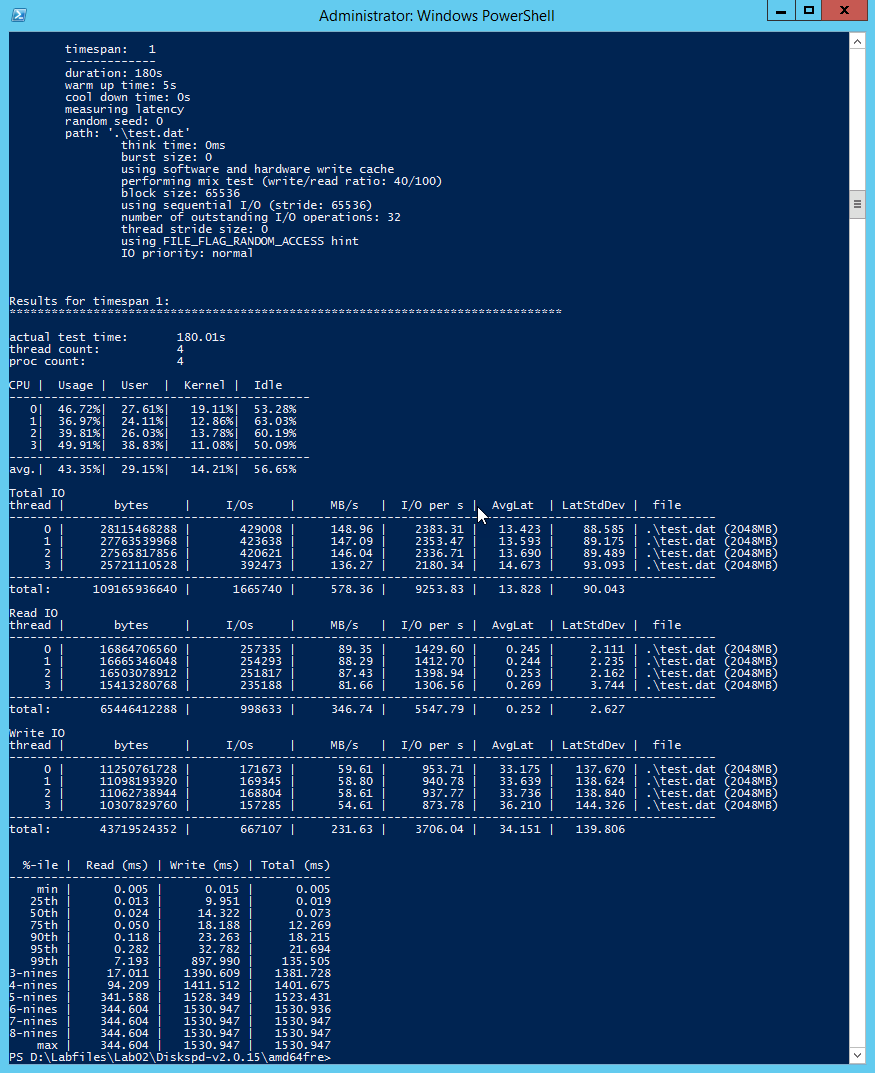
– IOPS measures the number of physical transfers that a storage device—such as a hard disk drive (HDD), an SSD, or a SAN—can perform in one second. For example, a device that has 10,000 IOPS can perform 10,000 transfers in one second.
– DiskSpd replaces the older SQLIO for load testing on disks.
!! Look at WMIC.exe on Windows Server 2012
Tuesday
Session 4 – Memory
You can establish whether SQL Server is under memory pressure by looking at the metrics:
• Buffer cache hit ratio. The number of pages SQL Server was able to fetch from memory.
• Page life expectancy (PLE). The length of time a page stays in the buffer pool.
• MEMORY_ALLOCATION_EXT wait. Waits associated with allocating memory from the operating system or the internal SQL Server pool.
• RESOURCE_SEMAPHORE wait. An internal SQL Server worker process executing a query is waiting for a memory request to be granted. This wait occurs when many simultaneous queries exhaust the allocated memory. This will correspond to an increase in the value of the SQLServer:Memory Manger\Memory Grants Pending performance counter.
• Working set trimmed log message. Under external memory pressure, the working set memory of SQL Server is trimmed and paged out to the page file. An error message containing the text “A significant part of SQL Server process memory has been paged out” will be recorded in the SQL Server error log.
A SQL Server instance that is not experiencing memory pressure will generally have a buffer cache hit ratio above 90 percent and a high page life expectancy. If either value is low or they change rapidly, then the SQL Server instance is experiencing memory issues that need investigating.
Buffer cache hit ratio and page life expectancy can be checked by querying the sys.dm_os_performance_counters DMV.
Query for obtaining buffer cache hit ratio for a SQL Server instance
Obtain Buffer cache hit ratio.
|
1 2 3 4 5 6 7 8 9 |
SELECT (pc.cntr_value * 1.0 / pcb.cntr_value) * 100.0 as BufferCacheHitRatio FROM sys.dm_os_performance_counters pc JOIN (SELECT cntr_value, OBJECT_NAME FROM sys.dm_os_performance_counters WHERE counter_name = 'Buffer cache hit ratio base' AND OBJECT_NAME = 'SQLServer:Buffer Manager') pcb ON pc.OBJECT_NAME = pcbb.OBJECT_NAME WHERE pc.counter_name = 'Buffer cache hit ratio' AND pc.OBJECT_NAME = 'SQLServer:Buffer Manager' |
Stored Procedures
Natively compiled stored procedures are fully compiled when they are executed giving more efficient execution. You can create them by adding a WITH native_compilation clause to a standard CREATE PROCEDURE Transact-SQL statement.
Because natively compiled stored procedures are compiled when they are executed, SQL Server can detect and correct errors at compile time before the stored procedure is ever executed. Traditional stored procedures, which are only compiled when they are first executed, will show up many error conditions only during first execution.
Natively compiled stored procedures offer a runtime performance improvement over traditional stored procedures because they are pre-compiled into native code, and do not have to be interpreted or compiled at run time. Natively compiled stored procedures include support for some features not available in traditional stored procedures, including:
• Atomic blocks: blocks of code that succeed or are rolled back as a single unit.
• Parameter NOT NULL constraints: constraints on parameters and variables that prevent them being set to NULL.
Session 5 – Concurrency and Transactions
Working with Row Versioning Isolation Levels
Row versioning isolation levels (SNAPSHOT isolation, and READ COMMITTED isolation with READ_COMMITTED_SNAPSHOT ON) have costs as well as benefits. In particular, row versioning makes use of tempdb to hold versioning data; you should ensure your storage subsystem can accommodate the additional load on tempdb before enabling a row versioning isolation level.
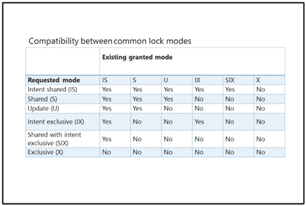
Locking and Latches
Locks – Logical
Latches – Physical
Lock Manager resolves dead-locks. It runs every 5 seconds unless more dead-locks are detected, then it runs more frequently. You can view dead-locks with sp_who2 and sp_WhoIsActive.
Lock Compatibility Chart
Cardinality Estimation
• Missing or bad statistics. This results in inaccurate cardinality estimation. The resolution is to create or update the relevant statistics or indexes.
• Functions in predicates. Statistics are not used for queries that join or filter columns using arithmetic or string functions. This can be resolved by precomputing the output of the function, either in a temporary table or a computed column.
• Table variables. SQL Server does not maintain a density vector or histogram for table variables; by default, the estimated row count for table variables is 1. This can have negative effects on performance as the actual row count of the table variable increases. This can be resolved in a number of ways:
o Use a temporary table in place of a table variable; temporary tables have a full set of statistics.
o Mark statements that use table variables for recompilation with the OPTION (RECOMPILE) hint. This forces the actual row count of the table variable to be used in the plan at the cost of additional recompilations.
o Use trace flag 2453. When this trace flag is enabled, changes in table variable row count can mark a statement for recompilation.
Wednesday
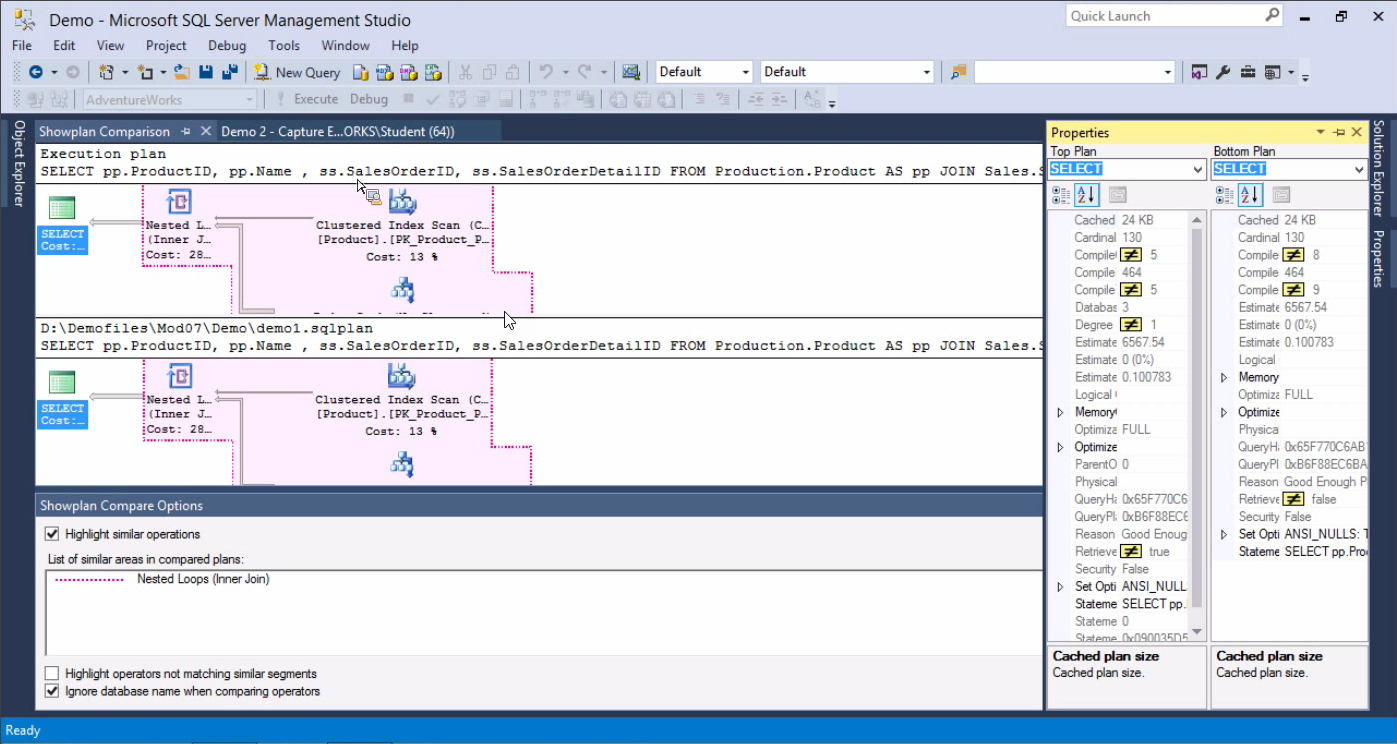
Session 7 – Query Execution and Plan Analysis
Comparing plans in SSMS (very cool! I know how to do this in PE but not in SSMS)
Session 7 – Plan Caching and Recomplication
Clear a cached pan (individual) with:
|
1 2 3 |
EXEC sp_recompile 'plan handle' or DBCC FREEPROCCACHE(0x050017002746973CA0FEDEE93400000001000000000000000000000000000000000000000000000000000000) --use the above DBCC command carefully as calling it without a handle deletes ALL plans in the cache! |
|
1 2 3 |
SELECT * FROM sys.dm_os_memory_cache_counters WHERE name in ('Object Plans','SQL Plans','Bound Trees','Extended Stored Procedures'); |
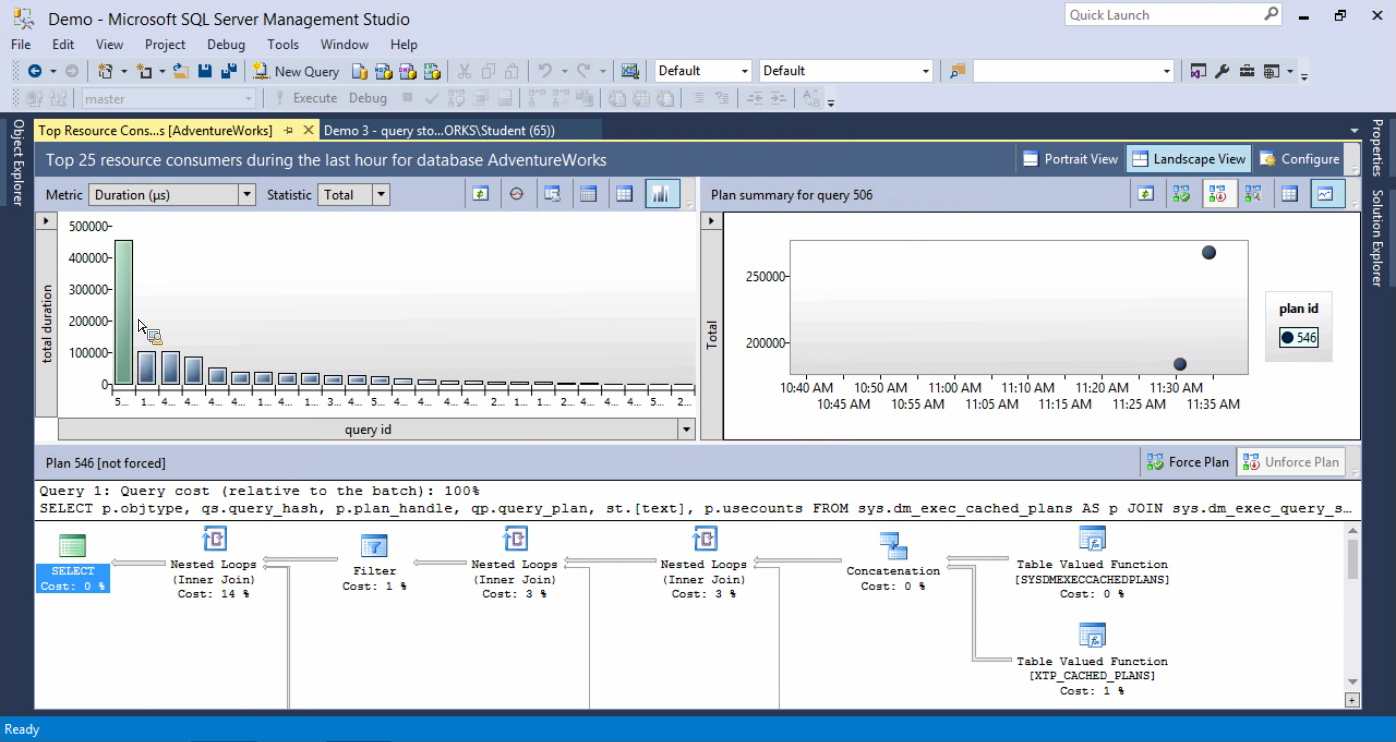
Query Store
Thursday
Session 9 – Extended Events
Seeing the live data monitor is where the cool stuff happens for Extended Events. Work through the sample code more and derive a template for our production servers usage.
– User defines session
o Session includes event
– Event triggers action
– Event is filtered by predicate
o Session writes to target
Module 10 – Monitoring, Tracing, and Baselines
Monitoring
PerfMon
Activity Monitor
SQL Profiler – intercepts queries to SQL Server, use minimalistically
SQL Trace
Database Engine Tuning Advisor
RML Utilities Readtrace Tool
Data Collection Using DMVs
The following query shows currently running workloads along with their resource consumption:
Current Executing Queries
|
1 2 3 4 5 6 7 8 9 10 11 12 13 14 15 16 17 18 19 20 21 22 23 |
SELECT @@SERVERNAME AS ServerName, DB_NAME(er.database_id) AS DatabaseName, er.session_id, (SELECT SUBSTRING(qt.[text],er.statement_start_offset/2, (CASE WHEN er.statement_end_offset = -1 THEN LEN(CONVERT(nvarchar(max), qt.[text])) * 2 ELSE er.statement_end_offset END - er.statement_start_offset)/2)) AS QueryText, er.start_time, er.status, er.Command, er.last_wait_type, er.wait_type AS current_wait_type, er.wait_time, er.cpu_time, er.total_elapsed_time, er.reads, er.writes, er.logical_reads FROM sys.dm_exec_requests er cross apply sys.dm_exec_sql_text(er.sql_handle) qt ORDER BY total_elapsed_time DESC |
The following query shows I/O usage for all database files in a SQL Server instance:
I/O Usage
|
1 2 3 4 5 6 7 8 9 10 11 12 13 14 15 16 |
SELECT DB_NAME(VFS.Database_id) AS DataBaseName, mf.file_id, mf.name As FileName, vfs.Sample_Ms, vfs.Num_Of_Reads, vfs.Num_Of_Bytes_Read, vfs.IO_Stall_Read_ms, vfs.Num_Of_Writes, vfs.Num_Of_Bytes_Written, vfs.IO_Stall_Write_ms, vfs.IO_Stall, GETDATE() AS DataCollectionDate FROM sys.Dm_io_virtual_file_stats(NULL, NULL) vfs INNER JOIN sys.master_files mf ON mf.FILE_ID = vfs.FILE_ID AND mf.DataBase_ID = vfs.DataBase_ID |
!! Look at the baseline scripts and see if we can use some of them.
Views – 3779